
Hot and Cold Spot Monitoring in Lyophilization
Differences in drying behavior caused by position effects due to radiation effects or the flow pattern of the shelf fluid, for example, are encountered within each freeze-dryer. The Tempris hot and cold spot monitoring technology constitutes a valuable option for reliable and rapid determination of Hot and Cold Spots (HCS) within a freeze-dryer. It can be used for all scales and sizes of equipment.
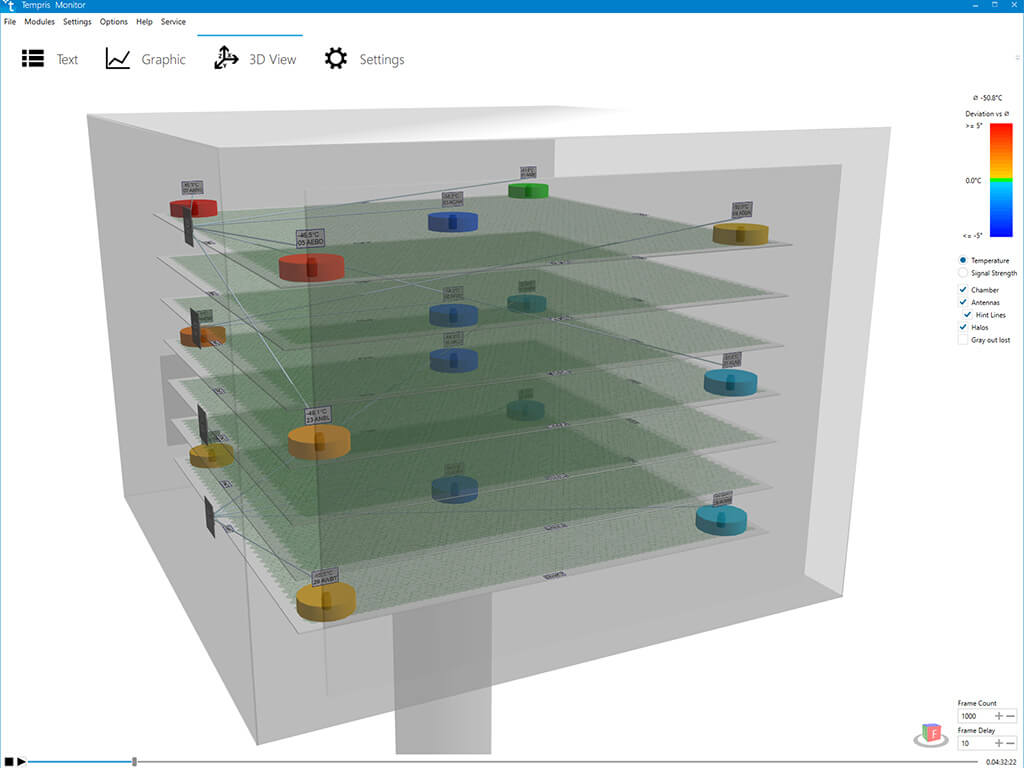
3D model in the Tempris TLM Software of a freeze-dryer with hot and cold spots
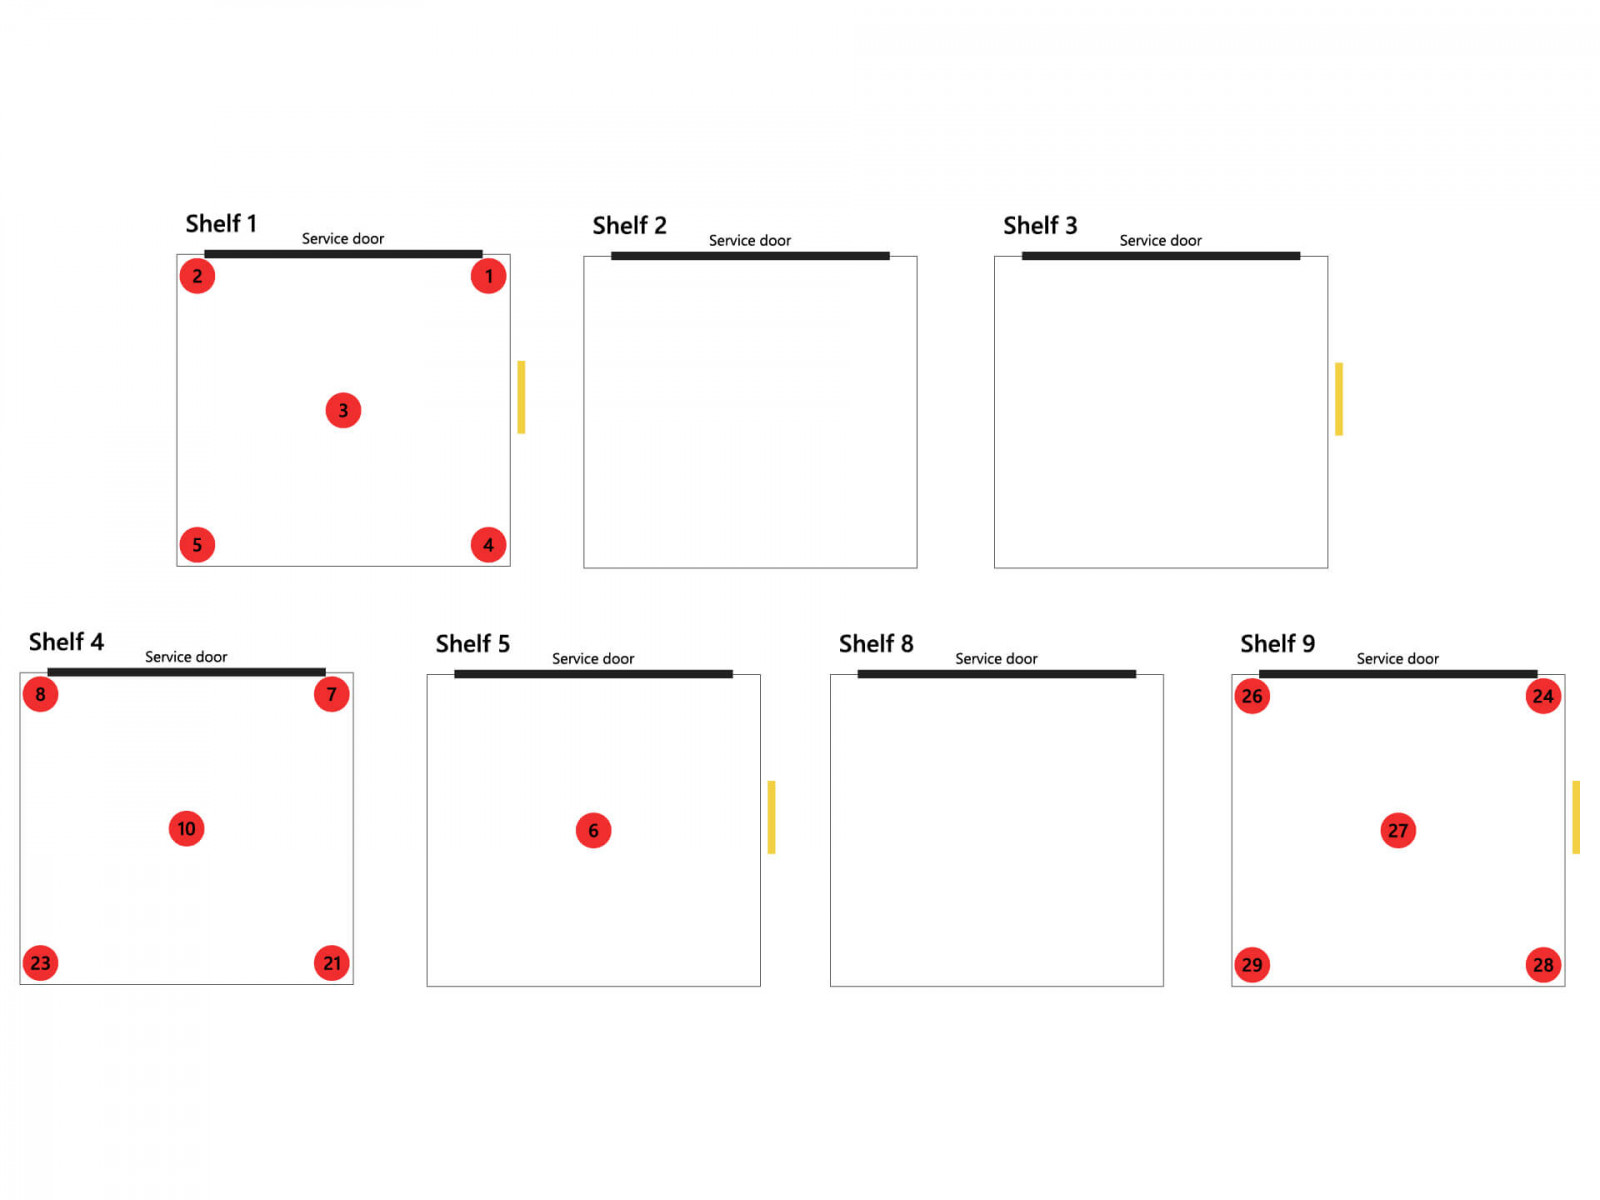
Sensor loading plan of measuring points in the TLM Software
When designing a freeze-drying process, batch PAT tools such as comparative pressure measurements or mass spectrometry can provide helpful information regarding the endpoint of primary and secondary drying. However, these technologies do not supply the user with data on heterogeneity and gradients within the batch. When the drying behavior of individual vials is investigated using single-vial monitoring technologies, position-dependent differences in product temperature during freezing and drying become apparent, which also affects the drying rate and primary drying time. These discrepancies between vials, depending on their position, are due to several factors, including radiation effects from chamber doors and walls, shelf temperature gradients, and cooling effects by the condenser. Tempris offers the possibility to comfortably qualify local differences within the batch, for example, as part of operational / performance qualification testing or in-process validation. Due to the wireless operation principle, this data can even be obtained in production freeze dryers with automatic loading systems under load conditions, thereby offering unique information most representative for subsequent production runs.
Hot and Cold Spot Monitoring – Case Study
A case study describing the application of Tempris sensors in the performance qualification of a HOF production freeze-dryer with an 8.78 m2 shelf area was recently presented. The nine shelves were fully loaded with 2R vials, each filled with 1 ml of water for injection. A total of 16 wireless Tempris sensors (size S) were introduced into vials in the bottom-center position before loading, and the instrumented vials were positioned on shelves No. 2, 4, 5, and 6 (top to bottom) in the center and edge positions. The product temperature data during an exemplary freeze-drying run was monitored using a Tempris Interrogation Unit.
Observations during Freezing and Annealing
Among the 16 sensors, several hot spots were identified that showed significantly higher plateau temperatures upon holding at -50°C. A direct comparison of the two overall hot spots to the prevalent cold spot during freezing and following annealing showed a temperature difference of up to 4°C.
Observations during Primary and Secondary Drying
In addition to stronger systematic gradients in product temperature of several °C during the steady state drying phase, primary drying was completed significantly earlier for vials in hot spot positions. The drying time was approx. 50% longer for the Tempris sensor in the coldest vial compared to the Tempris sensor in the vial at the warmest position. In addition, significant temperature elevation was apparent at the hot spot position at the holding time after completion of primary drying. The temperature at the hot spot was elevated by 3 – 4°C above the cold spot positions. In contrast, the sensor in the previous hot spot position ran a few °C lower than the one at the previous cold spot under secondary drying conditions. These paradoxical observations are due to the radiative cooling effect of the colder chamber walls or door.
Conclusion
After monitoring the temperature distribution with 16 Tempris sensors, we got a clear understanding of the variability of the process conditions in a production freeze-dryer. The sensors helped us identify temperature gradients in different process steps and significant differences in the drying time. Due to the flexibility of the Tempris sensors in terms of their positioning in the freeze-dryer and their high point-based measurement accuracy, the Tempris system is an attractive option for determining temperature gradients in freeze-dryers of all sizes.